What is Industry Benchmarking Data?
- Industry Benchmarking data is used to assess the performance of our account with the peers. (Or) Industry Benchmarking data refers to statistical information or performance metrics that represent the performance of our account within a specific industry.
- The data is gathered from various sources such as surveys, reports, and studies conducted across the companies or organizations within the same industry.
What is the use of Google’s Industry Benchmarking data for Publishers?
- You can use the Industry benchmarks card to compare the performance of your network to the performance of similar inventory across other publishers.
- Benchmarks data provide greater insight into why there are, for example, changes in performance, and they help explain to a publisher if these changes are relevant to them only, or to the industry as a whole.
- Though there are multiple sources to provide the industry benchmarking data Google’s data stood the top because Google is the market leader, and one can be confident as this is one of the largest and most reliable datasets.
Industry Benchmark widget in GAM and reporting:
By enabling the Industry Benchmarking widget, one can start using the card on the Overview Home dashboard of GAM. Please refer to the screenshot below for reference:

To enable or disable the widget one needs to follow the below steps Enabling Benchmarks data can only be done by users with the Administrator user role.
- Sign in to Google Ad Manager.
- Click Admin Global settings.

- Under “Network settings,” scroll down to “Report Settings.”
- Next to “Benchmark insights,” make your selection.
- To opt in to Benchmarks, toggle on the button.
Note: Your data is used in the calculations within a few days.

- To opt out of Benchmarks, toggle off the button.

- Note: Benchmarks data may continue to show for a few days. Thereafter, your data won’t be used in the calculations.
- Click Confirm.
Reporting of Industry Benchmarking in GAM:
- The main purpose of the industry benchmarking data in GAM is to show the relative change in metric from a currently selected time period to a previous time period of the same duration. For example, if you select the “Last 7 days” date filter, the values show the relative change between the last 7 days and the 7 days before that.
Dimensions and Metrics available:
- The benchmarking data is broken down by four different dimensions and they are as listed below: The listed dimensions can also be filtered based on the user’s choice by clicking on the drop down next to it.
- Continent
- Demand channel
- Device category
- Inventory type
- For the graphical representation of the data click on the expand symbol next to the dimension and it expands to a graphical representation of the data. Once can compare their network’s performance against the industry trends. Please refer to the screenshot attached below. The red line represents the Industry trends and the blue line represents the Network performance. Hovering the cursor on the line graphs represents the data by day.

- Like dimensions we also have multiple metrics and they are as listed below. Please refer to the screenshot below:
You can filter for metrics by clicking on the drop down next to the metric names.

Conclusion:
As mentioned above the industry benchmarking data in GAM provides data broken down by different dimensions and metrics which will help in deeper analysis to compare the network’s or publisher’s performance against the industry trends.
How can DataBeat help here?
The Yield Team at DataBeat brings extensive expertise in evaluating publisher performance relative to industry trends and providing tailored optimization strategies accordingly.
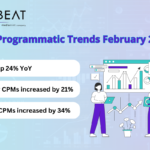
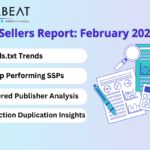
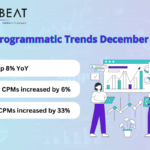
Apart from Google’s industry benchmarking we at DataBeat came up with our own industry benchmarking report which comprises the multiple partners within DataBeat’s Network. We track the monthly revenue of $75M, 50B impressions and 100 plus programmatic bidders data. Please refer to the screenshot below to know the DataBeats Benchmarking methodology.

Also, here is the link to the blog to know more about DataBeat’s Benchmarking data.