Issue
The client was looking for a solution to automate monthly financial reporting process to save manpower and time spent on reporting. In addition, the client also wanted summarized dashboards for the Executive level/ board members to have them focus on insights that matter to the business.
Solution
- Extracted finance data from various tools and created a Data Mart.
- Processed data in staging layer to standardize format, reducing manual effort.
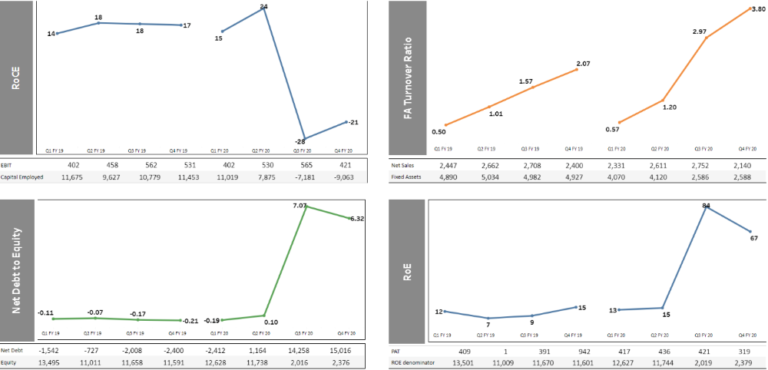
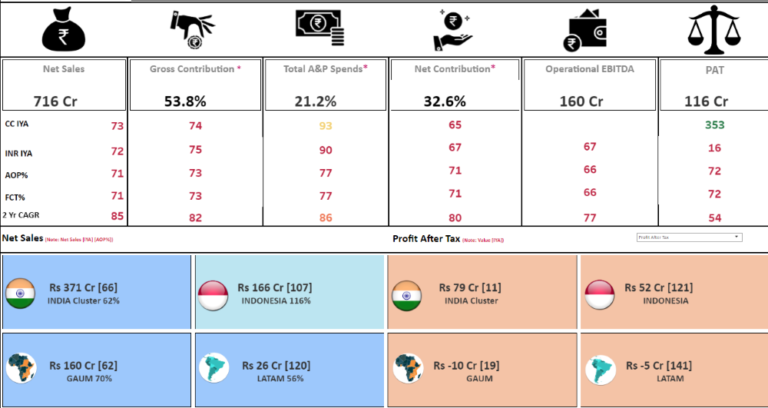
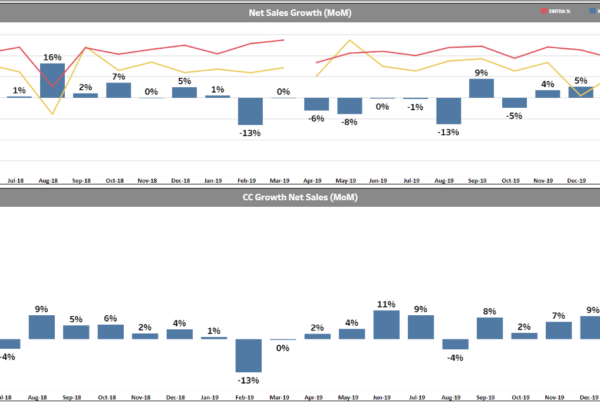
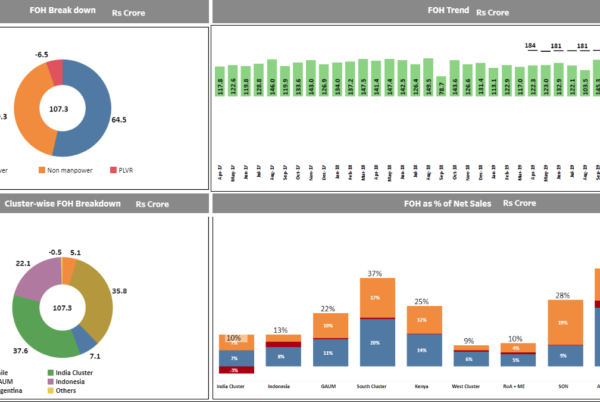
- Connected staging layer data to Tableau for intuitive graphs, views, and KPIs like Net sales, Gross sales, Fixed overheads, Working Capital.
Executive Dashboard
Performance Dashboard
Fixed Overheads
Impact
- Reduced financial close/reporting cycle time from 7 days to 1 day.
- Provided dashboards allowing drilldown and historical analysis on key metrics across businesses/regions.
- Offered management holistic view of financial KPIs across years/quarters/months.
Balance Sheet Parameters
