This month’s analysis highlights the impact of Amazon DSP blocking certain publishers, leading to notable declines in KPIs like bid rates. We examine how Amazon has reduced or halted bidding activity on select publishers and share insights gathered through their outreach communications. The analysis is supported by TAM-specific bidding trends, alongside broader performance metrics such as overall bid rates, fill rates, and CPM changes in the programmatic space of publishers, providing a comprehensive view of the impact and guiding future publisher strategy.
After noticing that TAM had abruptly limited or cut off access to Amazon DSPs for certain publishers, we reached out to those impacted to understand the root cause better. Based on their feedback and ongoing conversations with Amazon, the following key insights have emerged.
Inside the Amazon DSP Disruption: Causes, Impact, and Publisher Response
Technical Causes: Many publishers suspect that a missing GPID or bundle ID in bid requests may have triggered the cutoff. Others believe Amazon may be preemptively enforcing policy changes expected in 2025. When asked for clarification, Amazon cited policy violations.
Channel-Specific Drop-offs: The issue didn’t affect all inventory types equally. Some saw drops only in web, audio, or app traffic, indicating a selective disruption.
Widespread Impact Across Publishers: Large and small publishers alike were affected, suggesting the issue was not tied to size or spend but possibly due to compliance filters.
Bidding Recovered for Some Publishers: For a few, Amazon DSP bidding resumed after 2 to 7 days without any issues, pointing to a temporary or automated cutoff.
Community Shifting Strategy: Many are reviewing GPID and bundle ID setups and exploring alternatives to TAM to regain control and diversify demand sources.
In the next slide, you can see the clear impact of these shifts, with significant drops in fill rates and revenue for affected publishers, and increased spend for some unaffected ones likely benefiting from reduced competition.
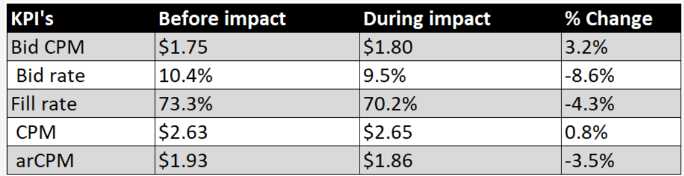
The primary impact of Amazon on publishers is observed in the revenue per request. Although the number of requests has remained stable, the overall revenue has declined due to a significant drop in fill rate. While there has been an increase in CPM, it has been outweighed by the decrease in fill rate. This shift highlights how Amazon’s reduced bidding activity is affecting monetization efficiency across the board.
ArCPM Drops with Fill Rate Impact :
- Even with higher bid CPMs, the drop in fill rate has had a bigger impact and caused ArCPM to slip by about 3.5%.
Fill Rate Decline from Reduced Bidding :
- Amazon’s reduced participation has led to fewer impressions being filled, resulting in a noticeable decline in fill rates.
Fewer Low Amazon Bids Lead to Higher Average CPMs :
- Amazon often places a large number of low-value bids, which brings down the overall average CPMs. As these bids reduce, average CPMs are starting to rise.
CPMs Rise from Non-Amazon Demand :
- CPMs from non-Amazon demand sources have increased, likely reacting to reduced competition within the TAM ecosystem.
Trend Seen Across Multiple Publishers :
- Multiple publishers are observing the same pattern, suggesting this is a widespread market development, not an isolated incident.
The broader takeaway from affected publishers is the need to diversify demand paths. Relying heavily on a single platform like TAM poses risks, and spreading demand can help reduce disruption from sudden policy or technical changes.
Report Overview:
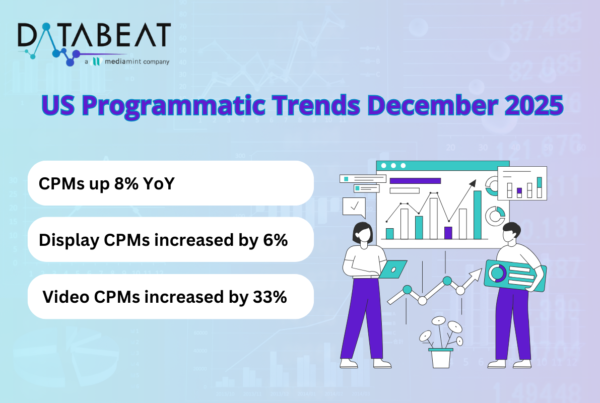
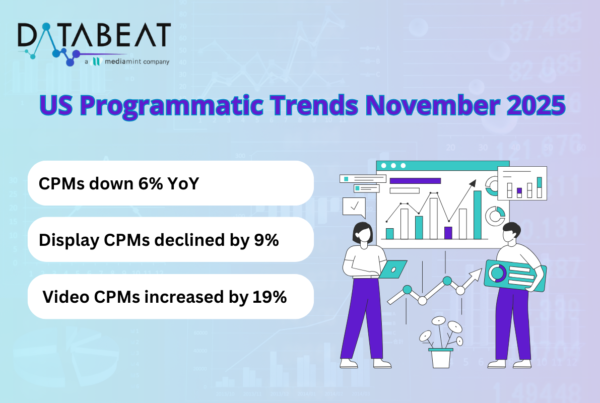
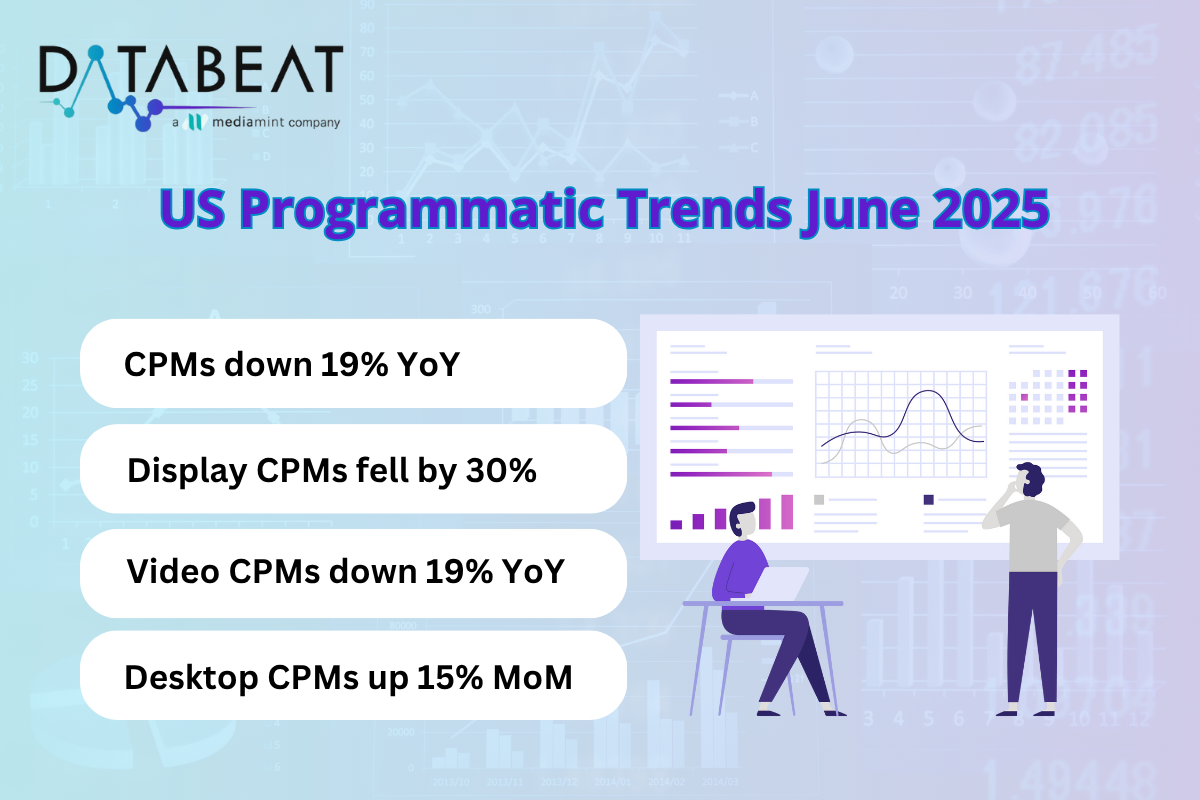
The DataBeat Programmatic Trends Report for June 2025 analyzes anonymized data from industry partners within the DataBeat network, focusing on programmatic advertising trends in the U.S. This report provides a detailed comparison of June 2025’s performance against both May 2025 and June 2024, offering insights into month-over-month and year-over-year changes.

Key Highlights:
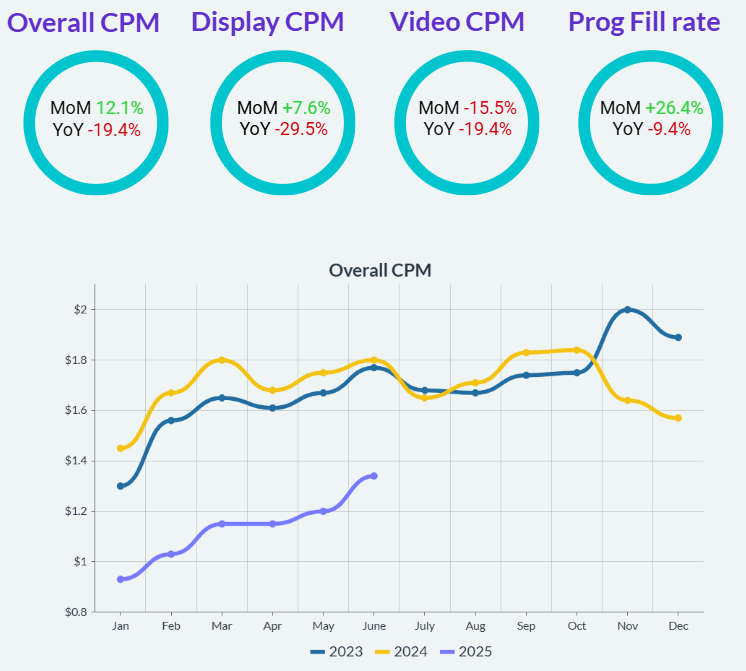
- MoM, Display CPMs increased by 7.6%, Video CPMs decreased by 15.5%, resulting in a 12.1% increase in overall CPM.
- YoY, Display CPMs declined by 29.5% and Video CPMs decreased by 19.4%, leading to an overall CPM decrease of 19.4%.
The YoY decline in CPM from June 2024 to June 2025 may be influenced by the broader US political cycle. CPMs in June 2024 were notably elevated, likely due to early PMP campaign activations tied to the primary season as political parties began nominee selections. Following the 2024 election cycle, political ad spend has likely normalized. In addition, economic uncertainty linked to Trump’s renewed political activity may be dampening consumer confidence and tightening marketing budgets. This effect appears more pronounced among Chinese companies and marketplace sellers, who were previously strong contributors to ad revenue growth across social and retail media platforms. Their financial headwinds may be contributing to the softer CPM environment observed in 2025.
To mitigate the impact and drive recovery, publishers should focus on diversifying demand sources, optimizing floor prices, and leveraging header bidding to increase competition. Additionally, exploring high-performing ad formats and strengthening direct deals can help stabilize revenue in the coming months.
Here’s a look at industry trends, broken down by inventory and demand.
1. Display Trend
- Display CPMs increased by 7.6% month-over-month and experienced a 29.5% decline year-over-year.
- Almost all SSPs saw a month-over-month CPM decline, with an exception to Amazon, Rubicon and Ad Exchange. When looking at year-over-year performance, all SSPs have seen an overall decrease in CPMs.
2. Video Trend
- Video CPMs went down by 15% month-over-month and experienced a 19% decline year-over-year.
- CPM performance was evenly split among SSPs, with half experiencing a month-over-month decline and the other half showing growth. When looking at year-over-year performance, all SSPs saw a year-over-year CPM decline.
3. Device Trends
- Mobile CPMs saw a month-over-month increase and Desktop CPMs saw a month-over-month increase, with Mobile up by 1% and Desktop up by 15%. Year-over-year declines were also observed, with Mobile falling by 31% and Desktop by 19%.
- CTV CPMs increased month-over-month and decreased year-over-year by 18% respectively. Ad Exchange claimed the top rank in terms of volume.
4. Programmatic Integrations
- Prebid leads the market with a 42% share, closely trailed by AdX, also at 42%, TAM at 20%, and EBDA at 7%. While CPMs for integrations such as Prebid and TAM mostly decreased month-over-month, year-over all integrations mostly saw a decline in CPMs.
5. AdX Advertisers
- Among advertisers, Adobe surged ranks to claim one of the top positions, with a CPM of $1.30 with a 63% MoM incline.
- Google also saw notable rank increases, maintaining CPMs at $1.72, with Google experiencing a 69% CPM increase.
6. AdX Bidders
- Google Ads and DV360 remain at the top in ranking among bidders, other bidder rankings remained relatively stable.
- Most AdX bidders experienced an increase in CPMs month-over-month, with the exception of RTB House, Yahoo DSP, and The Trade Desk which showed a decrease in their CPMs.
For a detailed overview, please download the full report.